
Coronavirus spread in pictures
We're also talking about it here and, of course, taking our measures to prevent infection. Of course, we wouldn't be Business Data Challengers if we didn't also do something with all the data on the spread!
Here we immediately see the challenge of doing something with this to present this information as clearly as possible.
Bassam Shoukri published his contribution on LinkedIn in which he shows the dashboard with the data on the spread of the coronavirus.
“We all now hear or talk about Coronavirus and maybe even know some people who are already infected with this Covid-19 virus. We have made a dashboard that shows the outbreak of this virus based on the open available data on the internet to get a better view about the spreading of Coronavirus.”
Bassam created the dashboard based on data he found on this corona counter: https://www.worldometers.info/coronavirus/
This is a great example of how you can quickly display important data in a way that everyone can understand!
If you'd like to learn more about what we can do for your organization to visualize your data, please contact us. You can also connect with Bassam!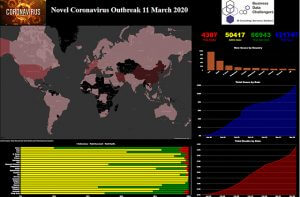
Naturally, we advise anyone who wants to follow current data on the virus to visit the websites of the RIVM and the WHO (World Health Organization).
Business Data Challengers
![]()